
Figure 7.
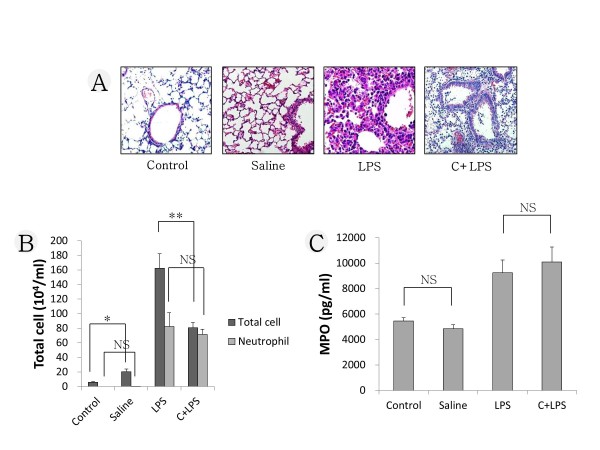
Comparison of degree of lung injury. (A) Representative images of H&E-stained lung sections from four experimental groups. (B) Number of inflammatory cells in bronchoalveolar lavage (BAL) fluid. (C) Result of myeloperoxidase (MPO) analysis. LPS, lipopolysaccharide; C, cyclophosphamide; I, imatinib; N, nilotinib. *P <0.05; **P <0.01; NS, non-significant.