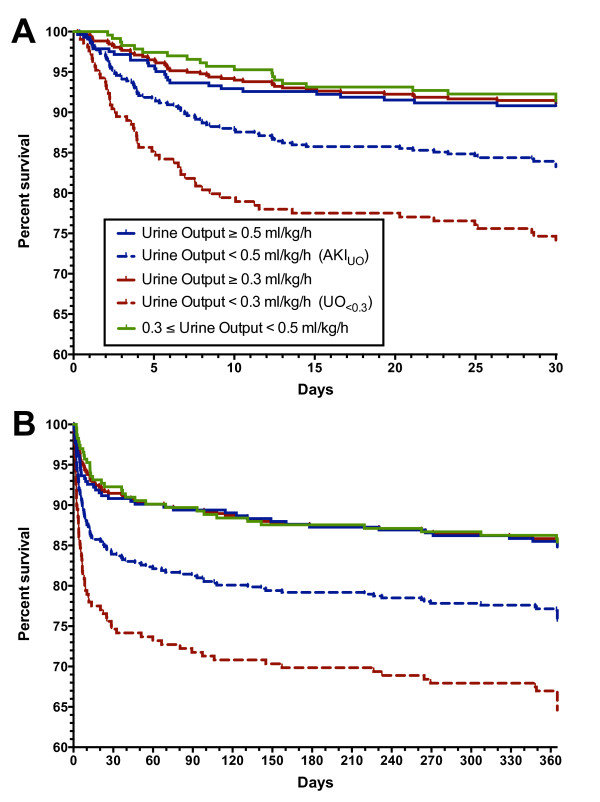
Figure 2.

Kaplan-Meier survival curves. (A) In-hospital mortality. (B) One-year mortality. Log-rank test (Mantel-Cox): P <0.0001 for urine output <0.3 ml/kg/hour (UO<0.3) compared with urine output ≥0.3 ml/kg/hour in both cases (red lines), P <0.01 for urine output <0.5 ml/kg/hour (AKIUO) compared with urine output ≥0.5 ml/kg/hour in both cases (blue lines). There was no difference between urine output >0.5 ml/mg/hour (blue solid line) and 0.3 ≤urine output <0.5 ml/kg/hour (green line). (A) P =0.77, (B) P = 0.82.
