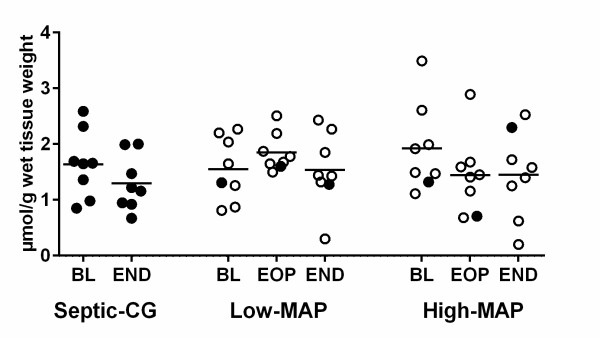
Figure 5.

Skeletal muscle tissue ATP concentrations in septic controls and animals resuscitated to low-mean arterial pressure (MAP) and high-MAP targets. The black horizontal bars represent the mean values. Filled circles represent animals that died early. P >0.05 for all comparisons. BL, baseline; EOP, end of observation period; END, end of the experiment (at 48 h of resuscitation, or before death if earlier).
