
Figure 2.
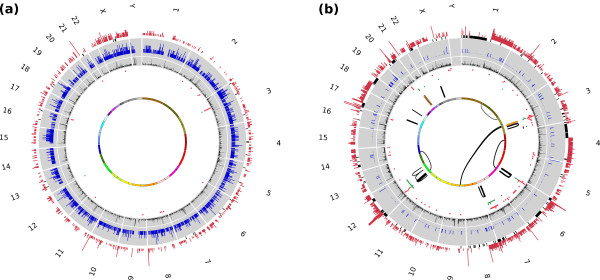
Map of somatic alterations in two gastric cancer genomes. The Circos plots depict the following information in order from outer to inner rings: using WGS data (1) CNVs (gain in red capped at 10 copies and loss in gray), (2) indel density (indel frequency per 10 kbp in blue, capped at 5 indels/10 kbp), (3) SNV density (SNV frequency per 10 kbp in black, each ring is 5 SNVs/10 kbp, capped at 10), and using DNA-PET data, (4) deletions (in red), tandem duplications (green) and inversions (purple), (5) intra- and (6) inter-chromosomal, insertions (orange) and unpaired SVs (gray).