
Figure 3.
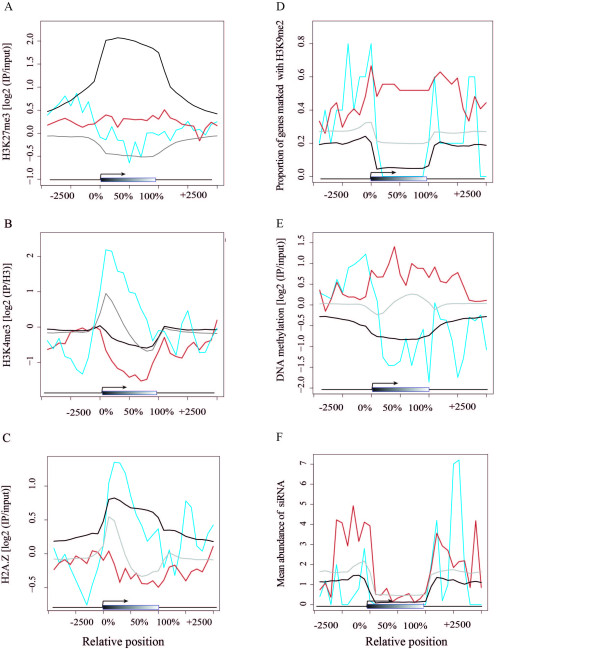
Association of Ler-specific H3K27me3 targets with chromatin modifications. The degree of overlap with histone-modification positive regions was plotted for 10% length intervals along the gene body and for 500 bp sequence intervals for the 5-kb regions up- and downstream for Rep_Col (red), Exp_Col (blue), common H3K27me3 target (black) and non-H3K27me3 target genes (gray). The x-axis shows the relative position (gene body indicated by gray box), the y-axis represents mean signal of the respective mark (for (a,b,c,e)), proportion of genes overlapping with the mark (d) or normalized mean feature counts (f). (a) Enrichment of H3K27me3, (b) H3K4me3 [27], (c) H2A.Z [41], (d) H3K9me2 [42], (e) DNA methylation [42] and (f) association with 24-nucleotide siRNAs [62] of Rep_Col, Exp_Col, H3K27me3 targets and non-targets.