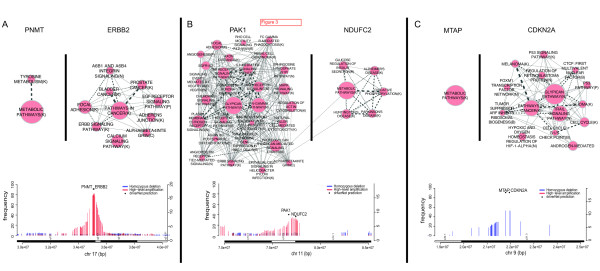
Figure 3.

Simultaneous modulation of metabolic pathways in copy number alterations harboring known oncogenes. EnrichmentMap [32] diagrams depicting Reactome pathways enriched in the set of outliers associated with pairs of genes that are co-amplified or co-deleted. In each pair, one gene is a known tumor suppressor or oncogene while the other is a metabolism gene. Pathways are shown as connected nodes in a graph where the size of the node indicates the number of genes in the pathway. Edges between nodes indicate genes common to both pathways where the thickness of the edge represents the degree of overlap. In general, little overlap was observed between metabolic drivers and oncogenic/tumor-suppressor drivers. (A) PNMT and ERBB2 co-amplified genes at the chr17q12 locus in breast cancer. (B) PAK1 and NDUFC2 co-amplified genes at the 11q14 locus in breast cancer. (C) CDKN2A and MTAP co-deleted genes at chr9p21.3 in GBM.
