
Figure 4.
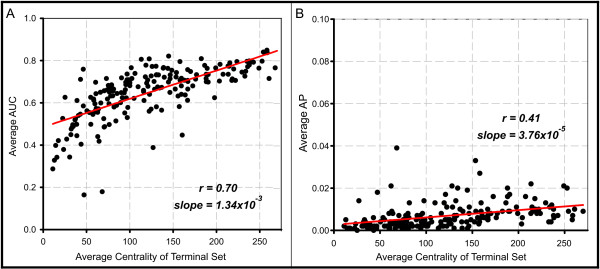
Central gene sets tend to score higher AUCs and APs. (a) In tests using random seed sets of various sizes and centrality to predict KEGG sets, the centrality of the terminal set correlates strongly with AUC (r = 0.70, slope = 1.34e-3). (b) Centrality of the terminal set also correlates with AP but to a lesser degree (r = 0.41, slope = 3.76e-5).