
Figure 3.
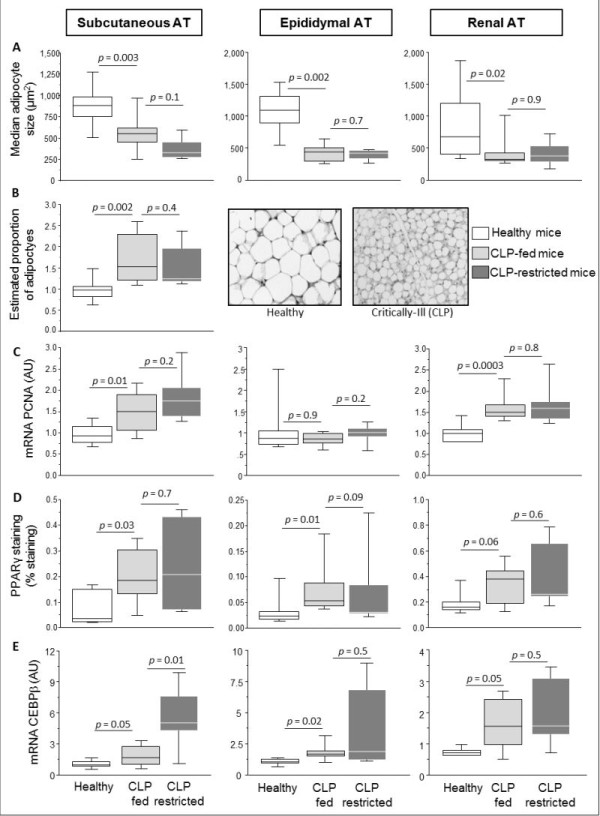
Adipogenic markers in subcutaneous and visceral adipose tissue of septic mice. The box plots represent median adipocyte size (A), estimated proportion of adipocytes and representative microscopic adipose tissue images of a healthy and a cecal ligation and puncture (CLP)-fed mouse (B), Proliferating Cell Nuclear Antigen (PCNA) gene expression (C), percentage stained area for peroxisome proliferator-activated receptor γ (PPARγ) (D), mRNA gene expression of CCAAT/enhancer binding protein-β (C/EBPβ) (E). AT is adipose tissue, A.U. is arbitrary units. Data boxes present median and IQR; whiskers represent the 10th and the 90th percentiles. For immunocytochemistry analyses in A, B and D, White boxes present healthy controls (n = 10), light gray boxes are critically ill mice allocated to the total parenteral nutrition (TPN) protocol (CLP-fed) (n = 6), and dark gray boxes are critically ill mice allocated to the nutrient restriction protocol (CLP-restricted) (n = 8). For gene expression analyses, the number of animals are healthy controls (n = 8), CLP-fed (n = 7), CLP-restricted (n = 6).