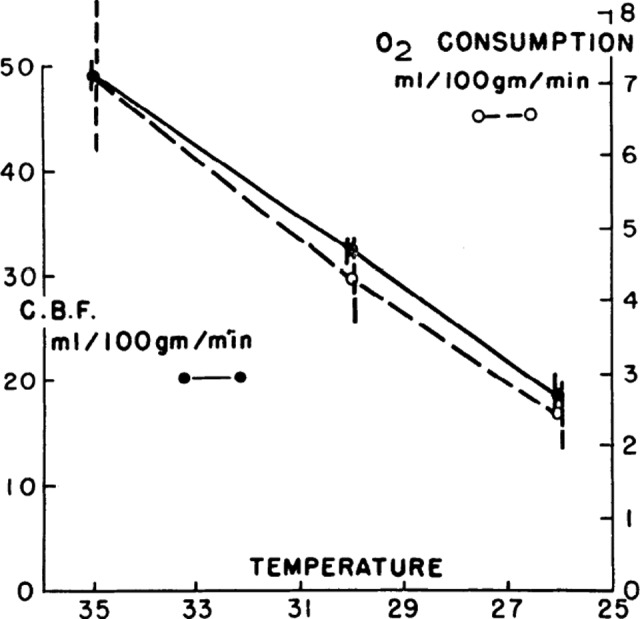
Figure 4.

Solid circles joined by solid lines represent mean cerebral blood flows of 4 animals at 35°C, 30°C, and 26°C. Open circles joined by broken lines represent mean cerebral O2 consumption of the same animals. Vertical lines represent standard error of each mean. Reprinted from Rosomoff HL, Holaday DA,9 with permission from the American Physiological Society.
