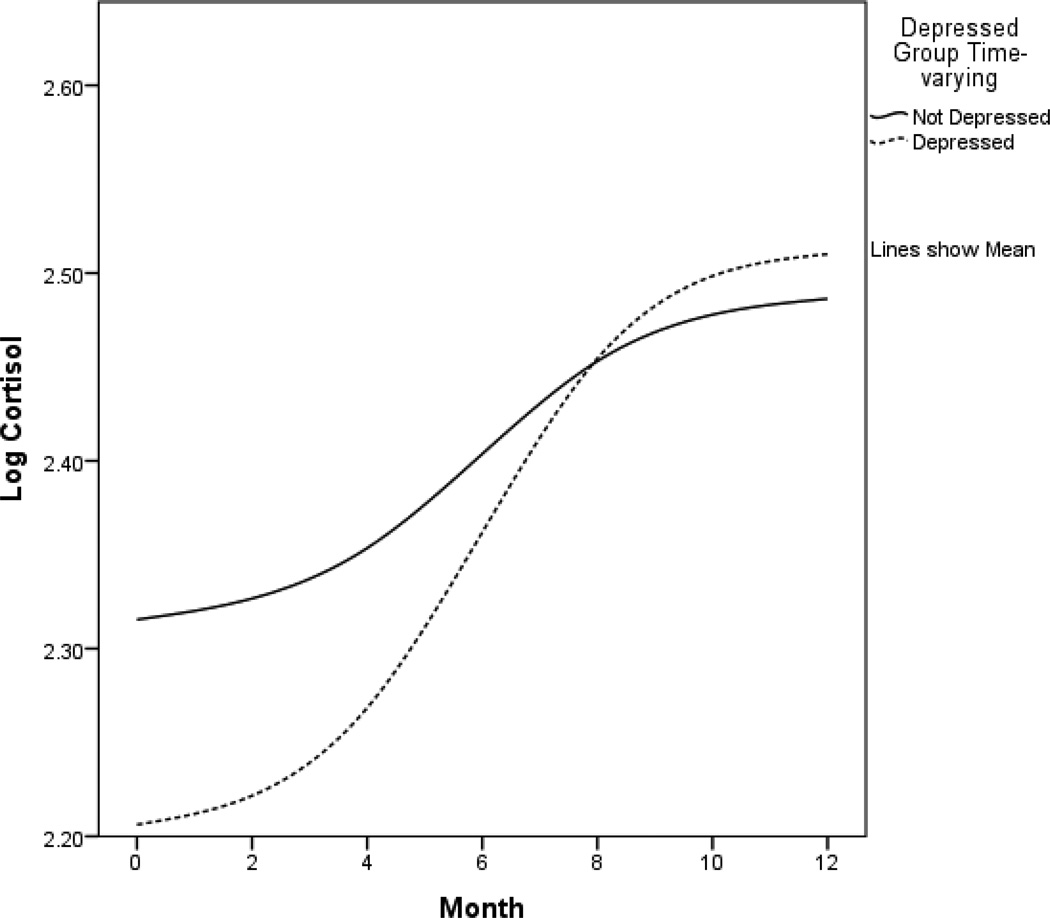
Figure 1.
Log-transformed cortisol trajectories. The y-axis refers to predicted cortisol level. Low and high depressive symptom groups were created using a cutpoint of 10 on the time-varying CES-D (CES-D at each assessment was used to create groups for that assessment) and are presented for graphical purposes only. The following variables were controls in all analyses: chemotherapy and radiation therapy, estrogen and progesterone receptor status, time from surgery to baseline, age, income, and study arm (intervention vs. assessment only). Sample sizes for the groups at each timepoint were as follows: baseline not depressed n=182, baseline depressed n=45; 4 months not depressed n=170, 4 months depressed n=27; 8 months not depressed n=171, 8 months depressed n=22; 12 months not depressed n=164, 12 months depressed n=20. CES-D=Center for Epidemiological Studies Depression Scale.

