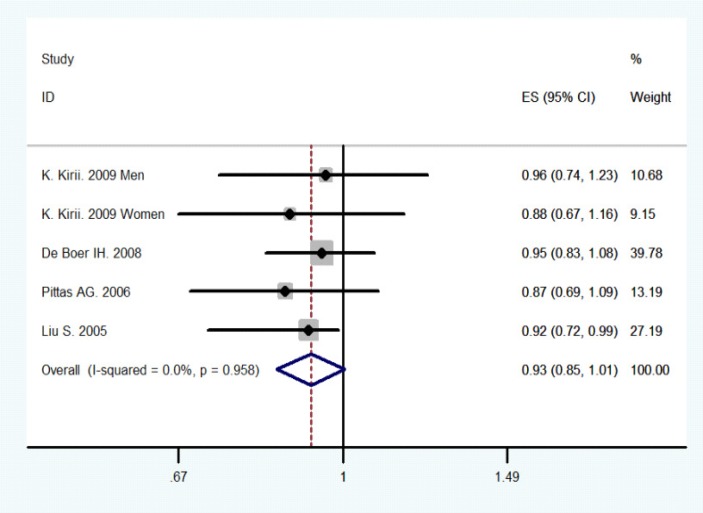
Figure 2.
Meta-analysis of vitamin D intake and type 2 diabetes (the highest versus the lowest category).
The size of the square is proportional to the percent weight of each study in the meta-analysis; the horizontal lines represent 95% CI. Studies are ordered by the year of publication. CI: confidence interval; ES: effect size.

