Figure 1.

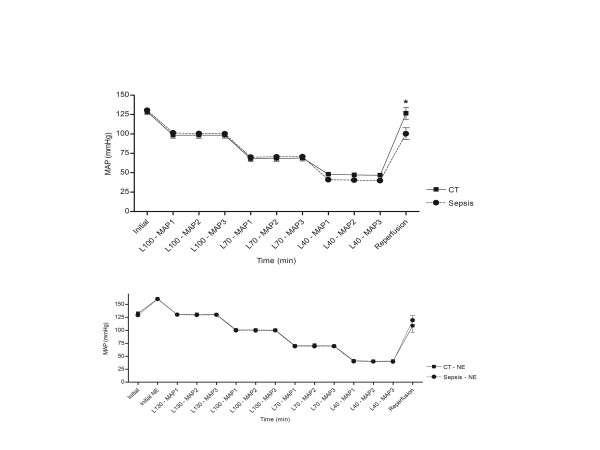
Graphical representation of mean arterial pressure (MAP) across the different experimental groups. Baseline (see materials and methods) measurements were considered as time = 0. CT: control; L: level; NE: norepinephrine.

Graphical representation of mean arterial pressure (MAP) across the different experimental groups. Baseline (see materials and methods) measurements were considered as time = 0. CT: control; L: level; NE: norepinephrine.