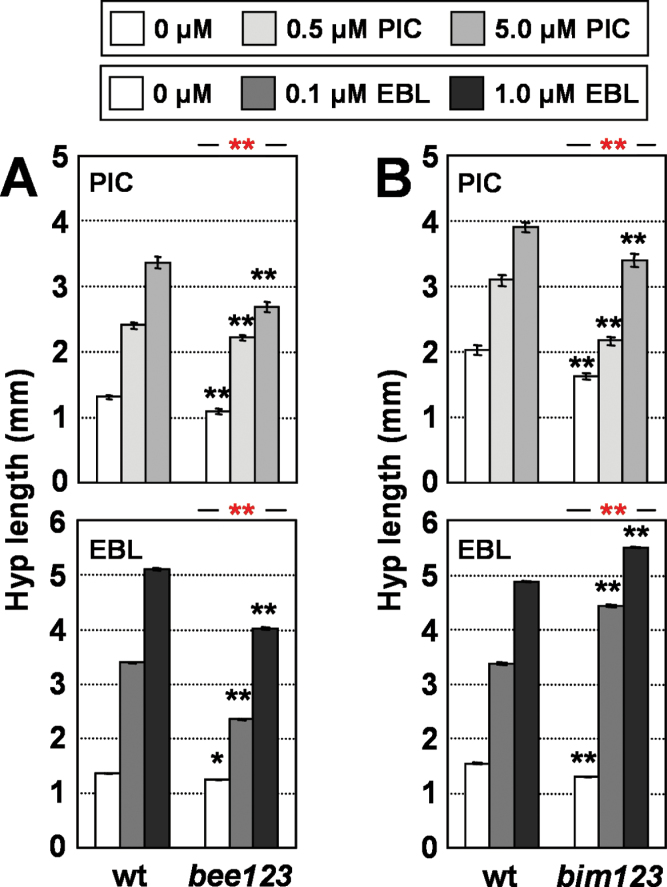
Fig. 6.
Hypocotyl response of bee123 and bim123 mutant seedlings to hormone application. Hypocotyl length of wild-type (wt), bee123 (A), or bim123 (B) seedlings germinated and grown under W for 7 d on medium supplemented with increasing concentrations of PIC (upper panels) or EBL (lower panels). Hypocotyl length was measured for each line and treatment. Values are means ±SE. Black asterisks indicate significant differences (Student’s t-test) relative to the corresponding wild-type plants; red asterisks indicate significant differences (two-way ANOVA) between genotypes in response to the corresponding hormone applied (*P<0.05, **P<0.01). (This figure is available in colour at JXB online.)

