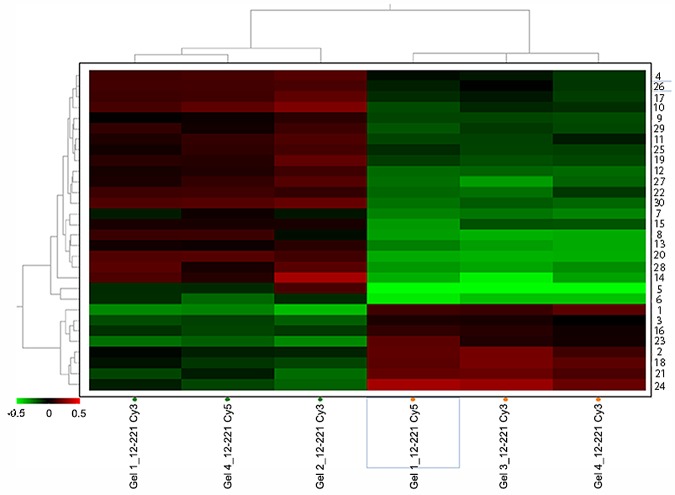
FIG 6 .
Relative abundance of proteins accumulated in the cln1 mutant under capsule-inducing conditions. The upper dendrogram shows the relationship among individual gels, while the left dendrogram shows the relationship among proteins. Hierarchical clustering analysis (HCA) was performed to obtain the values of abundance of every spot, which were then represented in a heat map. Different red spots show a positive relative abundance (cln1 mutant/H99 ratio), while different green spots show a negative relative abundance.

