
FIG 6 .
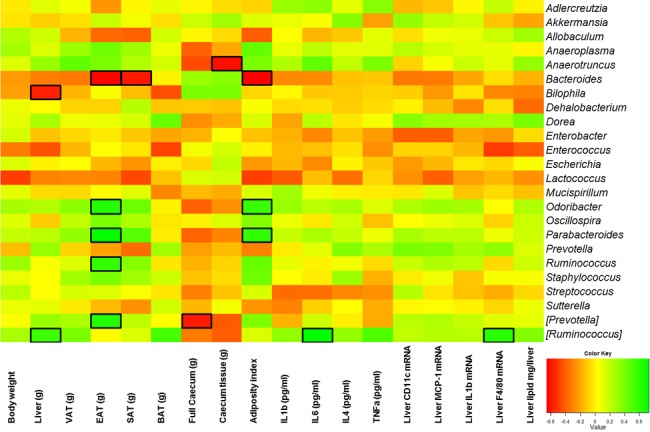
Specific genera are correlated with several host markers. The heat map shows the Spearman r correlations between the bacterial genera detected in the cecal contents of db/db mice treated with the vehicle (saline; db-CT; n = 15) or S. boulardii (db-Sb; n = 15). Square cells depict significant differences in treated and control animals following a Spearman correlation analysis. *, P < 0.05. BAT, brown adipose tissue; EAT, epididymal adipose tissue; SAT, subcutaneous adipose tissue; VAT, visceral adipose tissue weight.