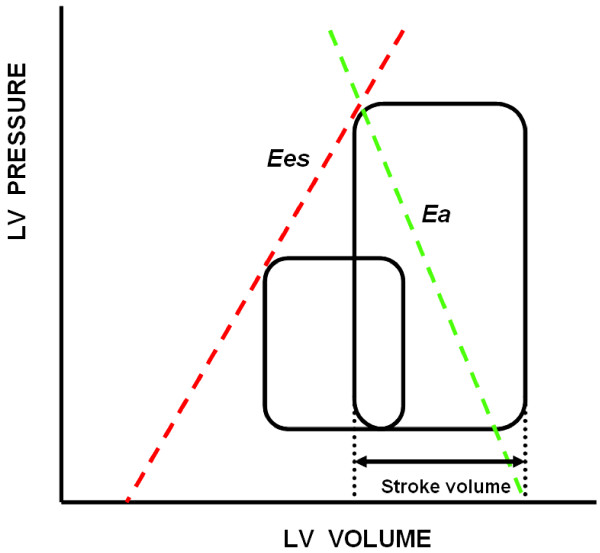
Figure 1.

Pressure–volume relationship in a cardiac cycle. The slope of end-systolic elastance (Ees) (red line) represents the end-systolic pressure–volume relationship. The slope of arterial elastance (Ea) (green line) represents the relation between stroke volume (SV) and left ventricular (LV) systolic pressure as SV is varied.
