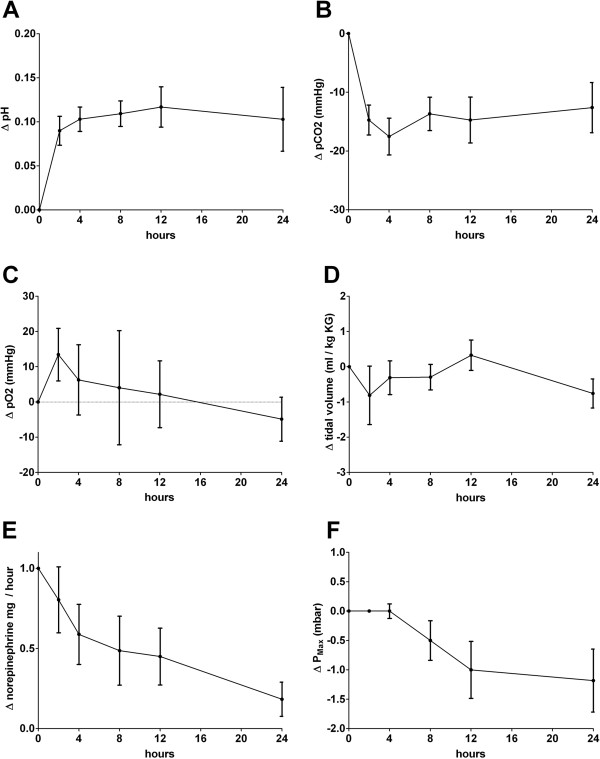
Figure 2.

Clinical effects of low-flow CO2 removal 4 and 24 hours after commencement of treatment. Graphs illustrate mean changes of values for pH (A), pCO2(B), pO2(C), tidal volume on respirator (D), norepinephrine dose at mg/h (E), and average changes in Pmax on the ventilator (F).
