
Figure 1.
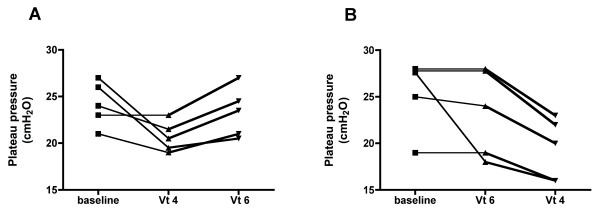
Individual changes in plateau pressure. The graphs present individual data of plateau pressure during the protocol, with the five patients randomized to the sequence Vt 4 to Vt 6 (ml/kg) (A) and the five patients randomized to the sequence Vt 6 to Vt 4 (ml/kg) (B). Vt, tidal volume.