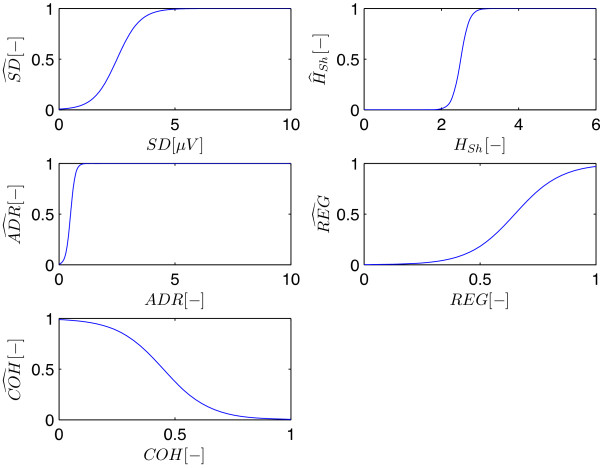
Figure 3.

Normalized qEEG scores. All five qEEG values are normalized using a smooth sigmoid function (Equations 3, 4, 5, 6, 7), resulting in score for each feature (annotated with a hat) between 0 and 1. (SD = standard deviation, HSh = Shannon entropy, ADR = alpha to delta ratio, REG = regularity, COH = coherence).
