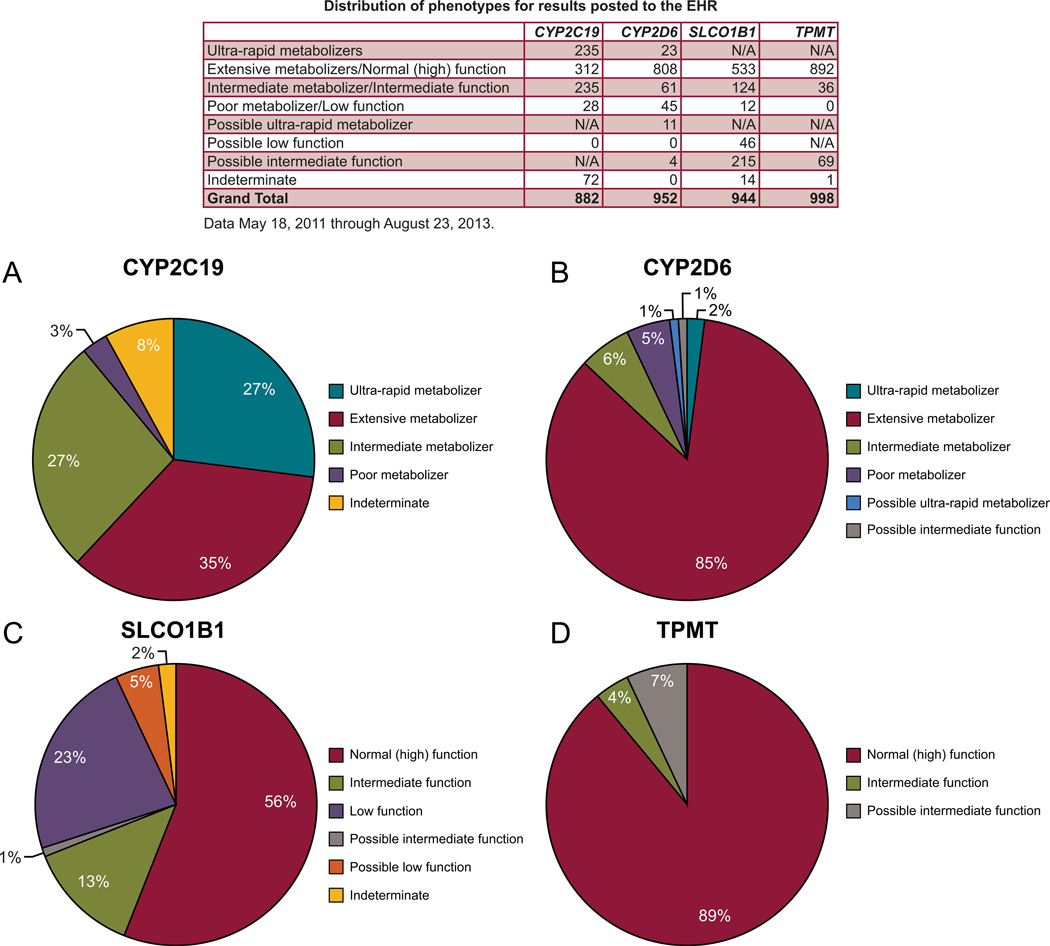
Figure 3. Distribution of Phenotypes on the PG4KDS Protocol.
Percentages for CYP2C19 (A), CYP2D6 (B), SLCO1B1 (C), and TPMT (D) are displayed. The table lists the number of patients with each observed phenotype. “Possible” phenotypes are defined as genetic test results that cannot distinguish between two statuses, but are partially informative. In these cases, either the most actionable phenotype or the most likely phenotype is labeled as possible. For example a patient with a TPMT result of “*1/*3A,*3B/*3C” is labeled as having a possible intermediate TPMT phenotype because it is > 100,000 times more likely than a low or absent function phenotype, and the test cannot distinguish whether the variants identified are on the same allele (*1/*3A, intermediate function phenotype) or on two separate alleles (3B/*3C, low or absent function phenotype). [Color figure can be viewed in the online issue, which is available at http://onlinelibrary.wiley.com/journal/xxx].

