
Figure 3. Telomere length in PBMC from individuals with POT1-Ser270Asn variant.
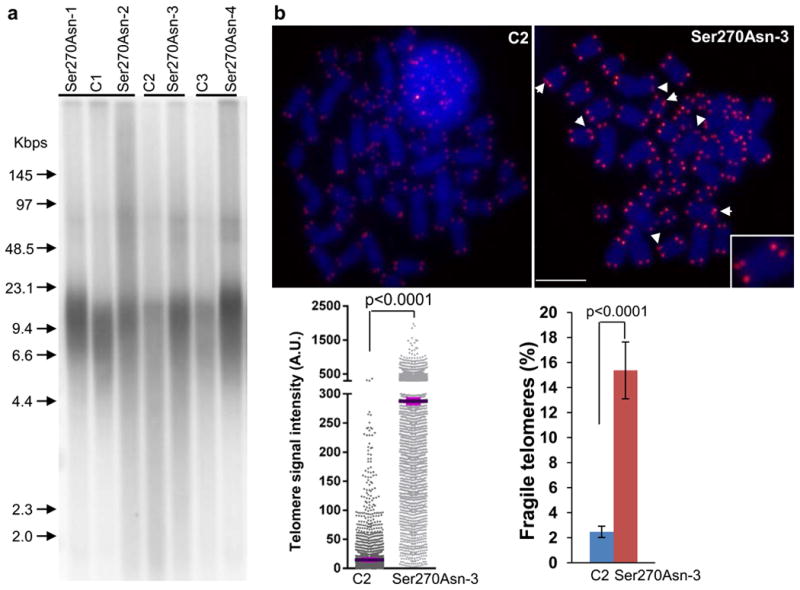
(a) telomere restriction fragment (TRF) analysis of PBMC. A representative blot shows telomere restriction fragments in each POT1 variant carrier (n=4) and the age-matched control (C, melanoma cases without POT1 variants, n=3). A labeled molecular weight marker (shown in kilobases) is used to determine telomere length. DNA was separated in a CHEF DR-II pulsed-field apparatus at 5 V/cm at an angle of 120° with switching times ramped from 1 to 15 s for 15 hours. Telomere length and heterogeneity are demonstrated by telomere signal intensities at higher and lower molecular weight. (b) Q-FISH analysis of ex vivo stimulated PBMC. Representative metaphase spreads of age-matched control and POT1 variant carrier showing DAPI staining (blue) and telomere fluorescence signals (red). Arrows: fragile telomeres (enlarged view demonstrated in the box). Left panel: quantitative measurement of telomere signal intensity in a jitter plot displaying complete distribution of telomeres with diverse signal intensity. Purple bars denote mean telomere signal intensity in a single control (C2) and a single Ser270Asn carrier (Ser270Asn-3). Additional variant carriers are described in Supplementary Fig. 6. Telomere signal intensity is depicted in arbitrary units (A.U). Right panel: Percentage of fragile telomeres in C2 and Ser270Asn-3. At least 30 metaphases / sample were counted. Error bars indicate standard deviation. P values were obtained from the Wilcoxon rank-sum test. The experiments were repeated three times on each sample.