
Figure 3.
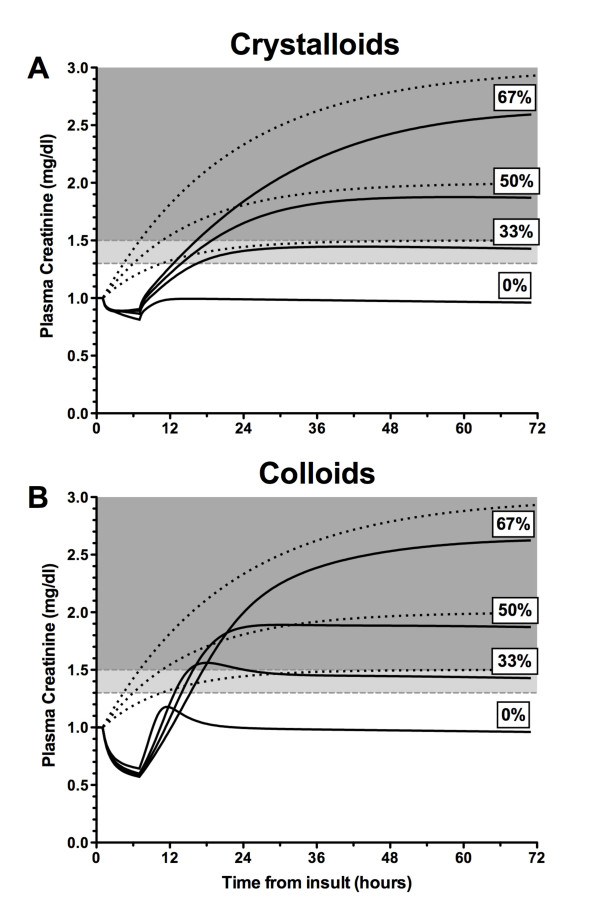
Simulated changes in plasma creatinine in the presence of reduced glomerular filtration rate (GFR). Plasma creatinine in a 70-kg male according to a plasma creatinine generation rate of 1 mg/minute and a baseline plasma creatinine of 1 mg/dL. Values are shown following an infusion of crystalloid (a) or colloid (b) at 1 L/hour for 6 hours. In each scenario, the creatinine curves (dark lines) are plotted for no loss (0%) and 33.3%, 50%, and 66.7% loss of GFR (step change) at t = 1 hour. Dotted lines represent the corresponding theoretical change in creatinine if there was no accounting for fluid balance or the 1.5%/day creatinine production reduction due to muscle wasting. Dark shading represents acute kidney injury (AKI) by the RIFLE (Risk, Injury, Failure, Loss, and End-stage kidney disease) definition (> 50% increase in plasma creatinine above baseline), and light shading represents AKI by the AKIN (Acute Kidney Injury Network) definition alone (> 0.3 mg/dL increase in plasma creatinine above baseline).