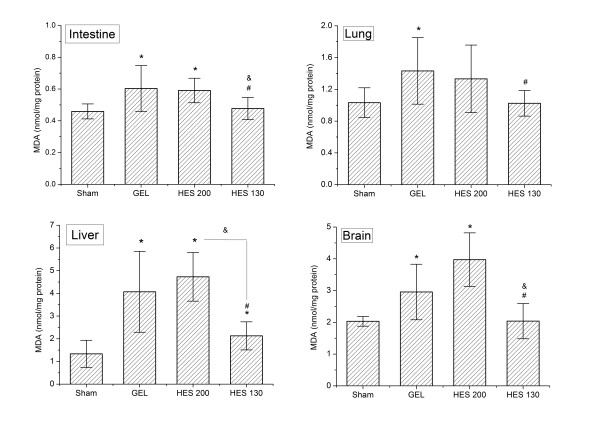
Figure 2.

Tissue MDA concentrations following HS/R. Data are plotted as the means ± SD. *P <0.05 versus the sham group; &P <0.05 versus the HES 200 group; #P <0.01 versus the GEL group. GEL, gelatin; HES, hydroxyethyl starch; HS/R, hemorrhagic shock/fluid resuscitation; MDA, malondialdehyde.
