Fig. 6.
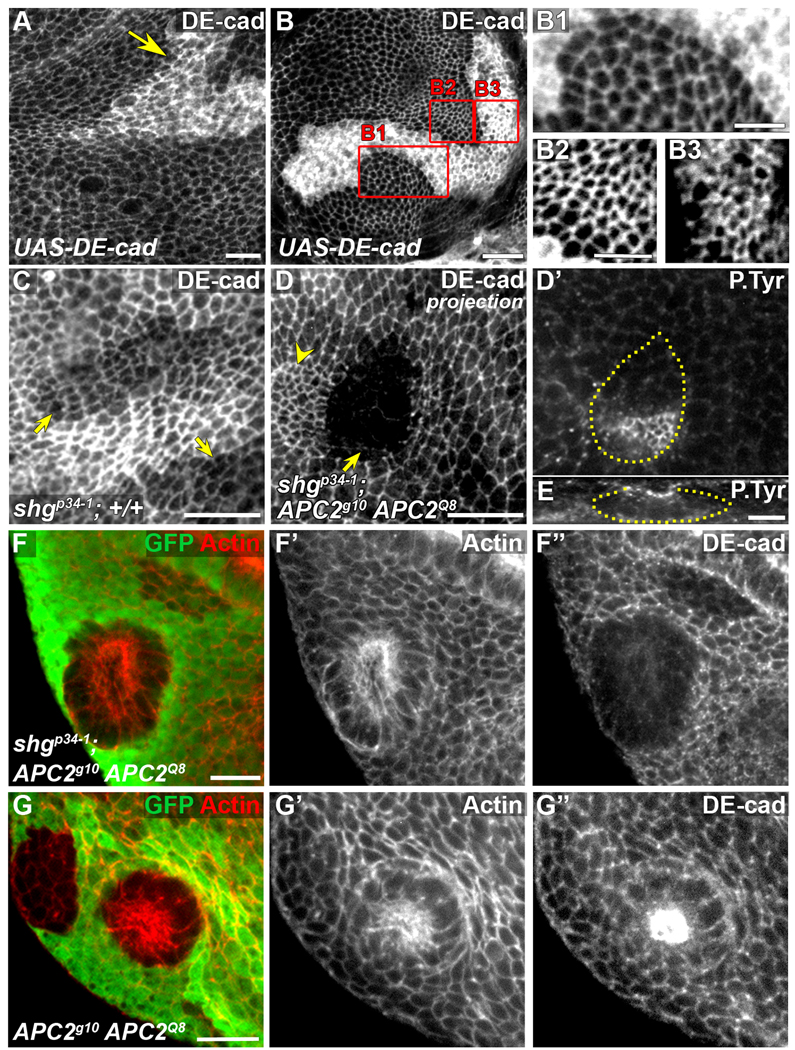
Elevated DE-cad is neither necessary nor sufficient for the APC null phenotype. Late 3rd larval instar wing discs. (A–B) UAS-DE-cad overexpression using act>CD2>GAL4 FLP-out, marked by elevated DE-cad. UAS-DE-cad clones in notum with no apical constriction and exhibiting uneven (A) or smooth (B,B1) borders (arrow). (B2, B3) Close-ups of areas in rectangles B2 and B3 in (B) reveal no difference in apical surface area between cells expressing wild-type levels of DE-cad (B2) and cells expressing elevated DE-cad (B3). Contrast was adjusted in B2 and B3 for comparison. (C) Hypomorphic shgp34-1 clones (arrows) have largely normal morphology with reduced levels of DE-cad. (D–E) Apically constricted shgp34-1; APC2g10 APC1Q8 clone in the wing pouch (arrow). Constricted cells next to the clone (indicated with yellow arrowhead) belong to a neighboring +/shgp34-1; APC2g10 APC1Q8 clone. (D’) Phosphotyrosine staining reveals constricted cells that are invaginating (E, cross-section of clone in D’). Plane in D’ is at the level of the AJs of the invaginated cells. Clone outline (yellow line) is based on absence of β-galactosidase (not shown) and DE-cad reduction. (F-F”) shgp34-1; APC2g10 APC1Q8 clones basally protrude like APC2g10APC1Q8 clones (G–G”). Scale bars: 10 µm in A, B, C–D’, F, G; 5 µm in B1-B3, E.

