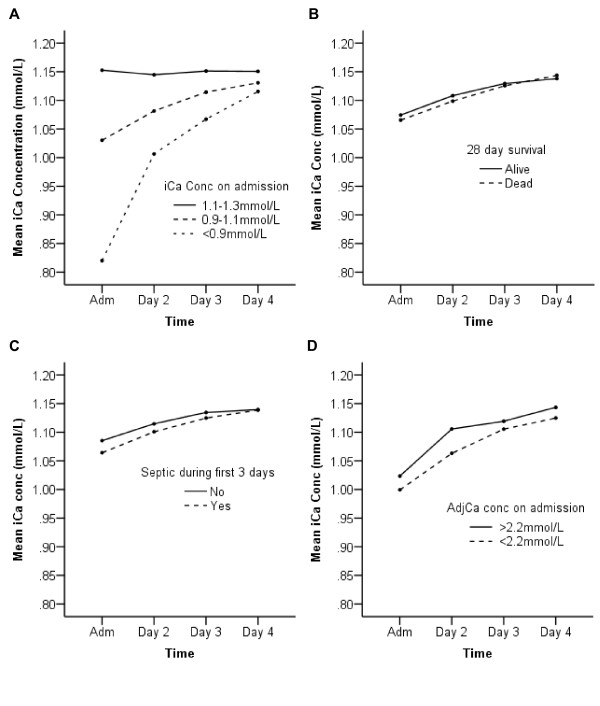
Figure 2.

Time course of mean ionized calcium concentrations over the first 4 days of admission. The mean ionized calcium concentrations for various population subgroups at admission and at 06:00 for the following 3 days are plotted. Repeated measures ANOVA was carried out for linear changes in iCa over the period. F and P values are based on the Greenhouse-Geisser adjustment. (A) Changes in mean ionized calcium concentrations for normocalcemic, mildly hypocalcemic and severely hypoclacemic patients. Time effect F = 273.6; P < 0.001, effect of calcium status on time effect F = 102.7; P < 0.001. (B) Comparison of changes in mean iCa concentration for patients that survived and those that died. Time effect F = 82.4; P < 0.001, effect of survival group on time effect F = 1.06; P = 0.35. (C) Comparison of changes in iCa between those who did and did not have sepsis within 3 days of admission as determined by a senior consultant using APPC/SCCM consensus guidelines. Time effect F = 99.2; P < 0.001, effect of sepsis status on time effect F = 2.22; P = 0.058. (D) Comparison of changes in iCa levels in patients with ionised hypocalcemia on admission who also had adjusted calcium <2.2 mmol/L and therefore received calcium supplementation and those who did not. Time effect F = 135.1; P < 0.001, effect of adjCa status on time effect F = 1.86; P = 0.15.
