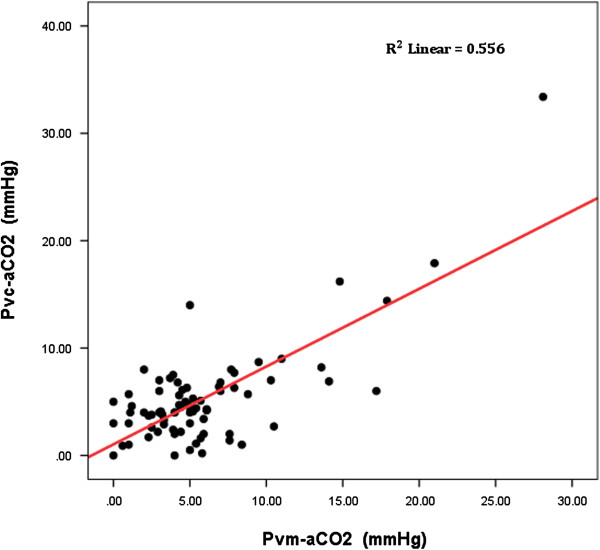
Figure 5.

Correlation between mixed venous carbon dioxide pressure and central venous-to-arterial carbon dioxide difference. Scatter plot representing the mixed-venous to arterial carbon dioxide (Pvm-aCO2) difference versus the central-venous to arterial carbon dioxide difference (Pvc-aCO2). Pearson correlation: 0.71 (95% confidence interval: 0.47 to 0.86); R2 = 0.55, P <0.001.
