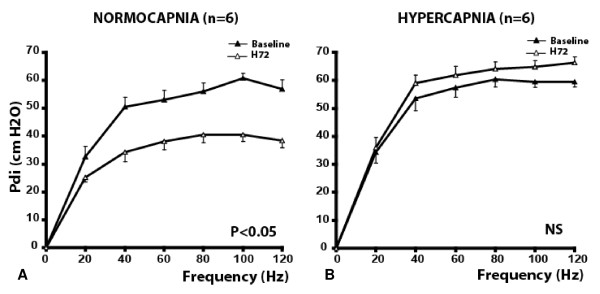
Figure 1.

Diaphragmatic pressure/frequency curves obtained in the Normocapnia group (A) (n = 6) and in the Hypercapnia group (B) (n = 6). Transdiaphragmatic pressure (Pdi) after supramaximal phrenic nerve stimulation at 20, 40, 60, 80, 100, and 120 Hz over a period of 72 hours of mechanical ventilation were obtained in both groups. In the Normocapnia group, Pdi significantly decreased between baseline and H72 at all frequencies (except at 20 Hz) (P < 0.05). No significant differences between baseline and H72 were observed for the values obtained at all frequencies in the Hypercapnia group. Data are expressed as mean ± SD. NS, not significant. P values refer to between H72 versus baseline.
