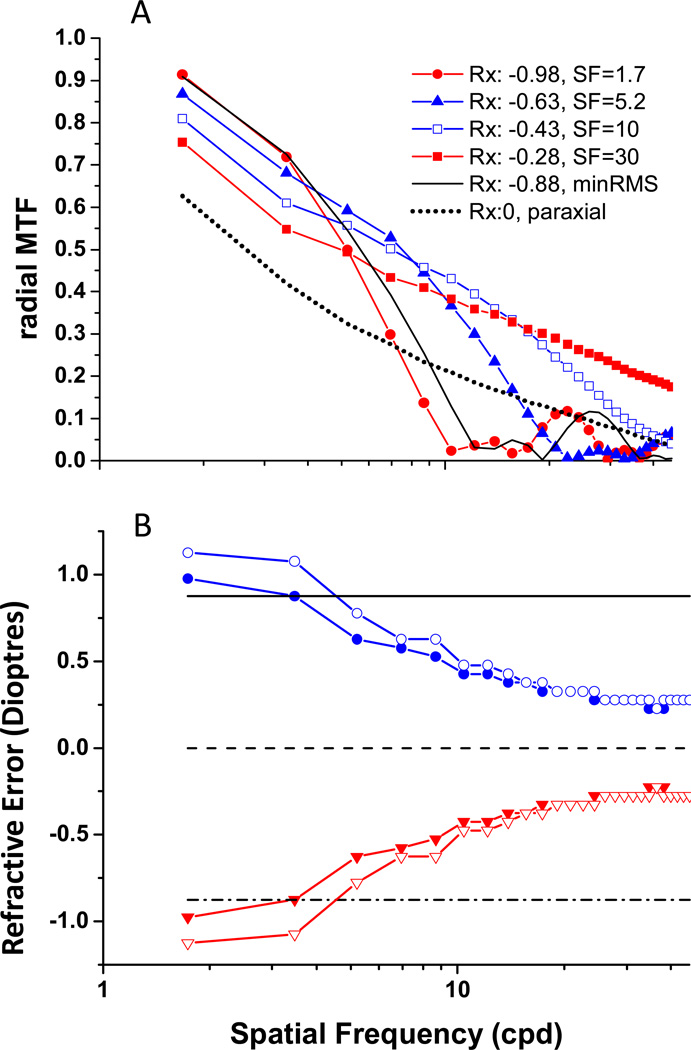
Figure 4.
A: Radially average MTFs for the model eye with 7 mm pupil, normal SCE and 0.4 µm of C40. Figure 4B: Rx as a function of SFs for +C40 (red) and − C40 (blue) either w/ SCE (filled) or w/o SCE (open symbols). Dash line: paraxial Rx. Solid line represents minRMS Rx when C40=−0.4µm, and dash-dot line represents minRMS Rx when C40=0.4µm.

