
Figure 2.
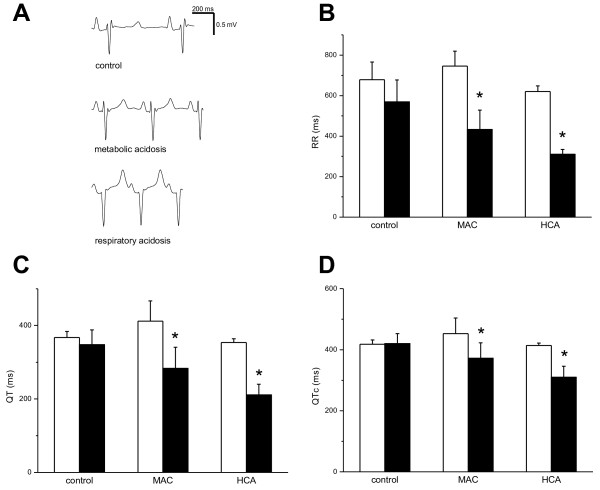
Effects of acidosis on electrocardiogram. Empty columns, baseline. Solid columns, acidosis (or corresponding time point in control experiments). *P < 0.05. (A) Representative electrocardiogram in control animal (upper trace), animal with MAC (middle trace), and animal with HCA (lower trace). (B) Effects of MAC and HCA on the RR interval. (C) Effects of MAC and HCA on the QT interval. (D) Effects of MAC and HCA on the QTc interval (corrected by the Fridericia formula).