
Figure 2.
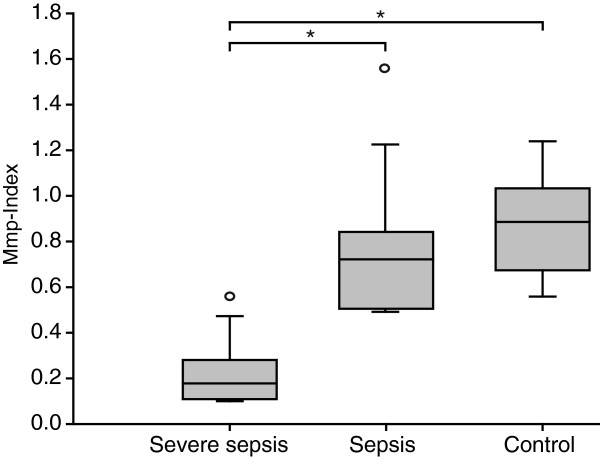
Comparison of platelet mitochondrial membrane potential of patients with sepsis, severe sepsis, and control patients. Box-and-whisker plots illustrate platelet Mmp-Index of patients with sepsis (nonsevere without organ failure), severe sepsis including septic shock, and control patients without infection. Lower Mmp-Index values indicate a loss of mitochondrial membrane potential. Platelet Mmp-Index was significantly lower in patients with severe sepsis compared with sepsis without organ failure (P < 0.0006) and controls (P < 0.0001). No statistical difference was found between patients with sepsis and controls (P = 0.42). Box margins identify the upper and lower quartiles; the horizontal line marks the median; and whiskers indicate minimal and maximal values. Outliers are indicated with a circle. *Statistically significant difference, P ≤ 0.05.