
Figure 1.
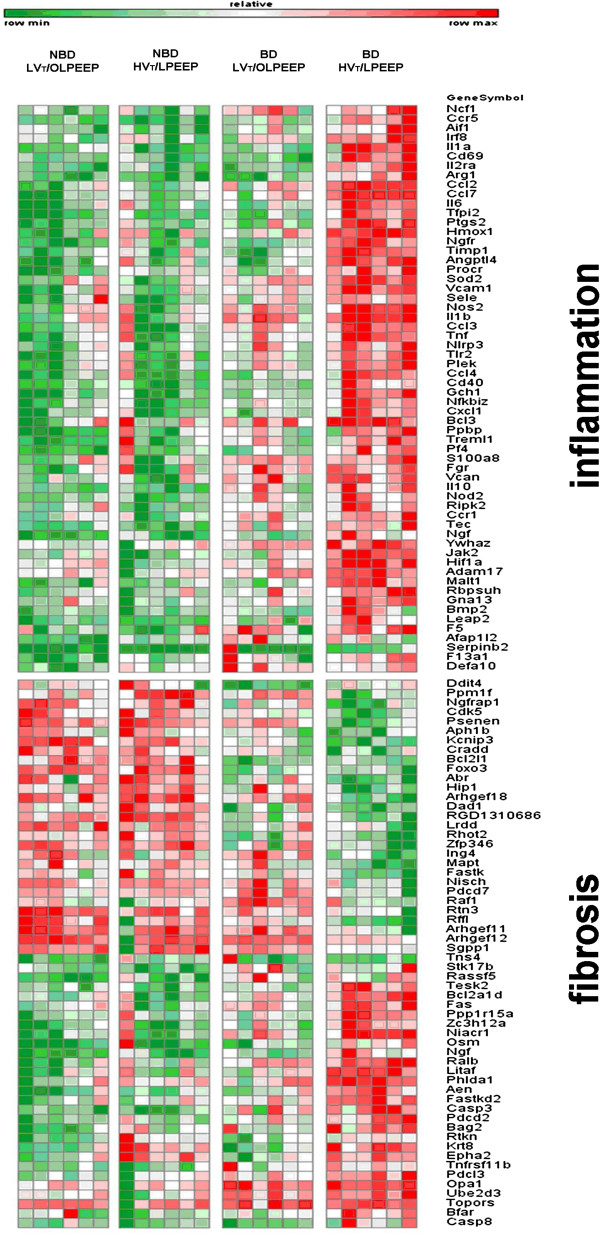
Heat map for gene expression. Genes were clustered using MAPPFinder. Gene ontologies of inflammation and fibrosis are shown. Red color indicates up-regulation, green color indicates down-regulation relative to the mean overall four treatment groups, while color intensity corresponds to the fold-change amplitude. BD, brain damage; HVT/LPEEP, six hours of high tidal volume ventilation with low PEEP, no brain damage; LVT/OLPEEP, six hours of low tidal volume ventilation with open lung positive end-expiratory pressure; NBD, no brain damage.