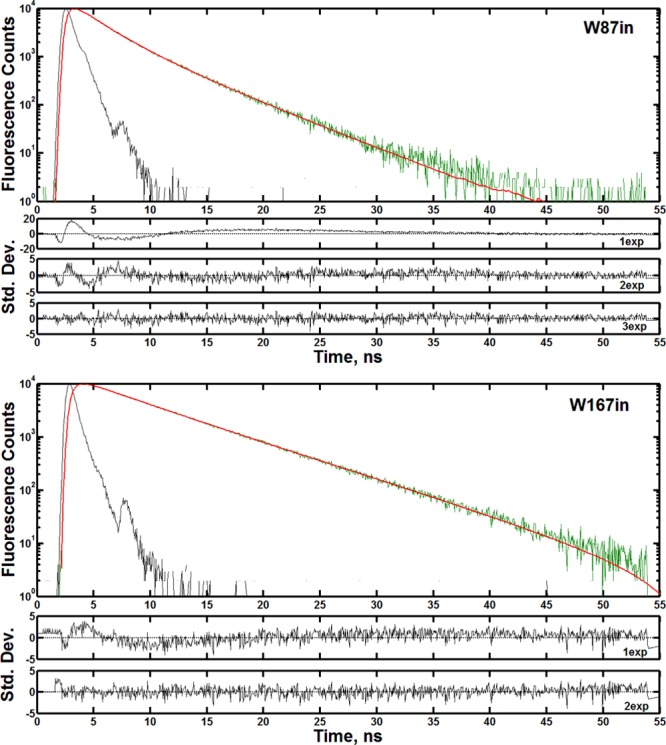
Figure 3.

Representative lifetime decays and residual errors for W87in (top) and W167in (bottom) at 30 °C. Decays were collected at the peak emission wavelength determined from the steady-state emission spectra for each single-Trp variant. Each panel contains the instrument response function (black), the raw decay data (green), and the final fit from which lifetime data were derived (red). W87in was fit as a triexponential; W167in was fit as a biexponential. The panels showing the residuals underneath the fluorescence traces are listed in order of increasing number of exponentials. The associated χ2 values for W87in are 15.29 (top), 1.44 (middle), and 1.01 (bottom) for a one, two, and three-exponential fit, respectively. For W167in, the respective χ2 values were 1.90 (top) and 1.10 (bottom) for one and two exponentials.
