
Figure 8.
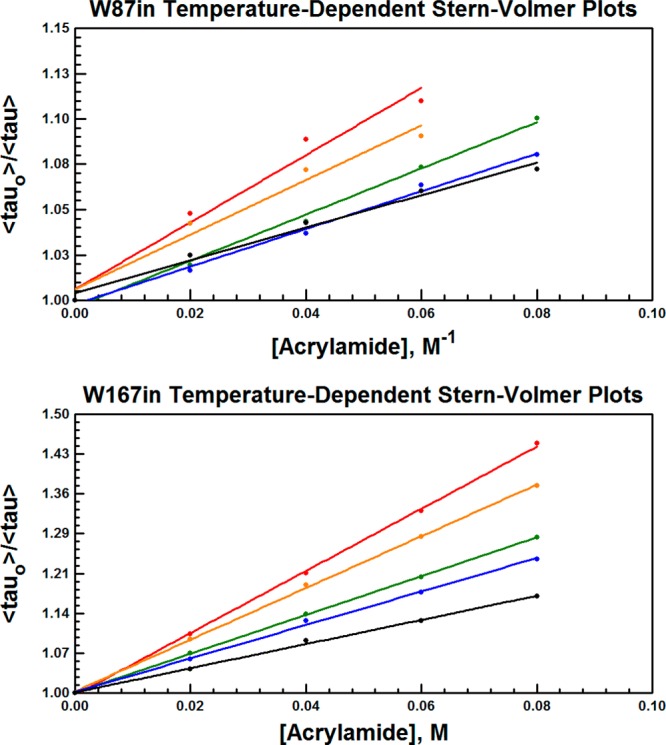
Collisional Stern–Volmer plots for W87in (top) and W167in (bottom). The representative temperatures are shown at 10 °C (black), 20 °C (blue), 30 °C (green), 40 °C (orange), and 50 °C (red).
Official websites use .gov
A
.gov website belongs to an official
government organization in the United States.
Secure .gov websites use HTTPS
A lock (
) or https:// means you've safely
connected to the .gov website. Share sensitive
information only on official, secure websites.
Collisional Stern–Volmer plots for W87in (top) and W167in (bottom). The representative temperatures are shown at 10 °C (black), 20 °C (blue), 30 °C (green), 40 °C (orange), and 50 °C (red).