
Figure 4.
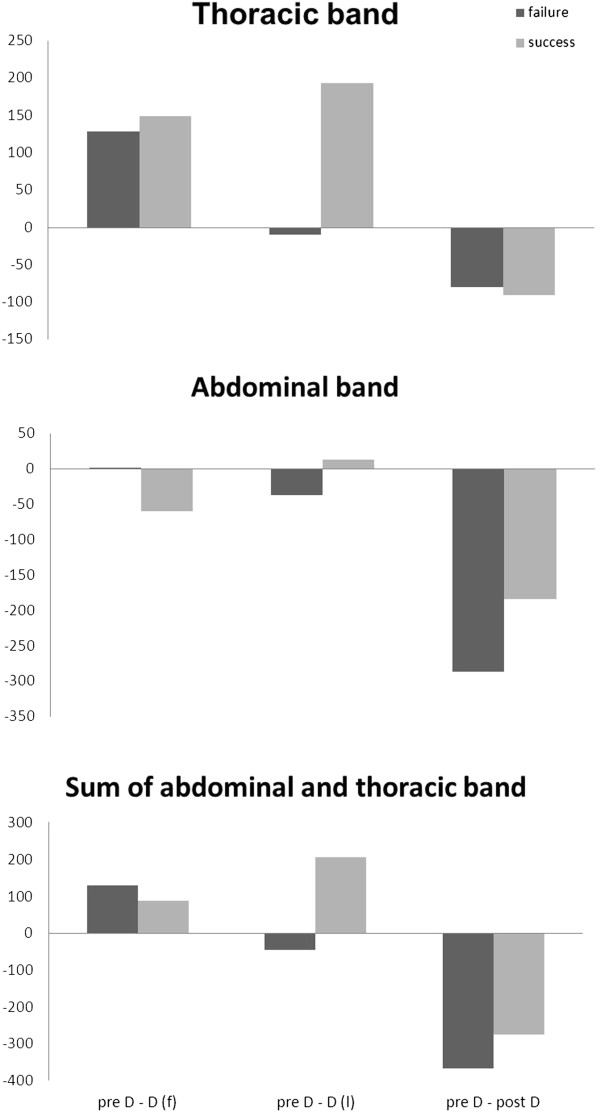
Respiratory inductive plethysmography (RIP) data illustrating changes in lung volume in relation to pre D during the spontaneous breathing trial (in arbitrary units). The figure shows RIP data during an SBT, presented as differences from pre-disconnetion values. Therefore, positive differences stand for a decrease in RIP, and negative differences stand for an increase in RIP. Dark columns represent failure patients, and light columns, the success patients. Please note: Compared with preD, there is a decrease in RIP values to D(f), and D(l); only the failure patients show increased RIP values.