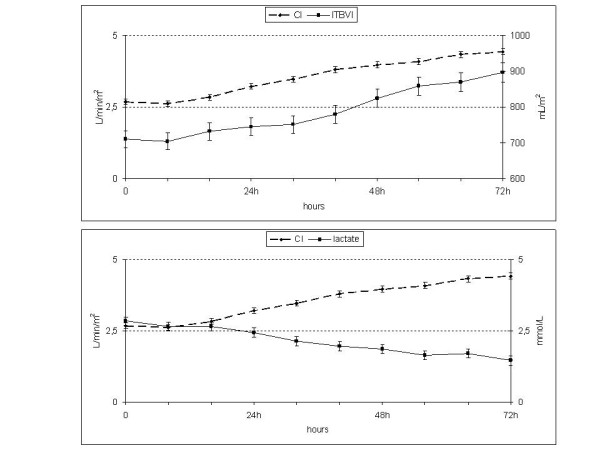
Figure 2.

ITBV, the CI and lactate. The table shows low initial values of the ITBVI and its progressive elevation, similar to the CI. Lactic acid mirrors the CI (lower panel). With below-normal preload, at 32 hours, the CI and lactate levels were normal. CI, cardiac index; ITBV, intrathoracic blood volume; ITBVI, intrathoracic blood volume index.
