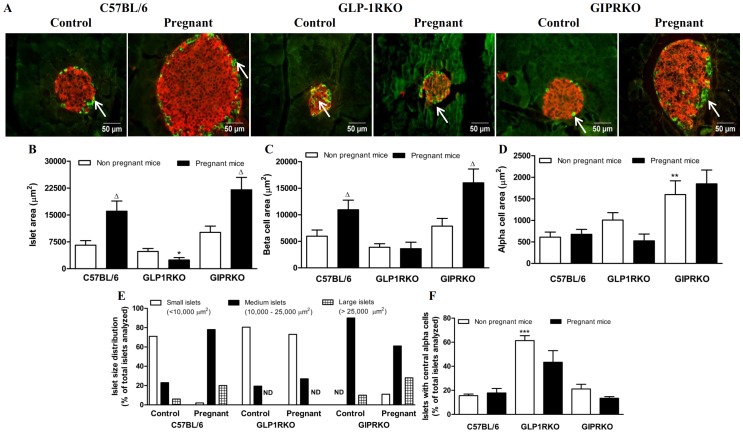
Figure 1. Islet analysis.
A: Representative islets showing insulin (red) and glucagon (green, indicated by arrows) immunoreactivity from non-pregnant and pregnant C57BL/6, GLP-1RKO and GIPRKO mice are shown. B: Islet area, expressed as µm2. C: Beta cell area, expressed as µm2. D: Alpha cell area, expressed as µm2. E: Islet size distribution, expressed as % of total islets analysed (n = 15 to 20 islets per animal). F: Islets with central alpha cells, expressed as percentage of total islets analysed (n = 15 to 20 islets per animal). Values are mean ± SEM of 6 observations unless otherwise indicated. Δp<0.05 compared to respective non-pregnant controls. *p<0.05, **p<0.01, ***p<0.001 compared to non-pregnant or pregnant C57BL/6 mice. ND, none detected.

