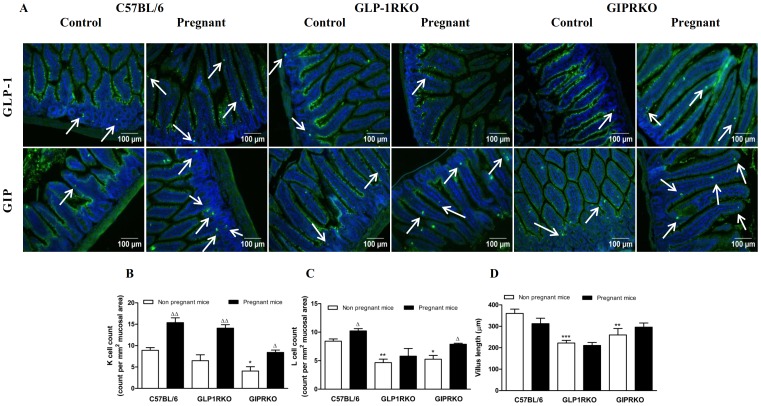
Figure 7. Intestine analyses.
A: Representative images showing GLP-1 or GIP (green) positive cells in intestinal mucosa of non-pregnant and pregnant C57BL/6, GLP-1RKO and GIPRKO mice are shown. Arrows indicate GLP-1 or GIP positive cells. B: Intestinal K cell count, expressed as count per mm2 of mucosal area. C: Intestinal L cell count, expressed as count per mm2 of mucosal area. D: Villus length, expressed as µm. Values are mean ± SEM of 6 observations. Δp<0.05, ΔΔp<0.01 compared to respective non-pregnant controls. *p<0.05, **p<0.01, ***p<0.001 compared to non-pregnant or pregnant C57BL/6 mice.

