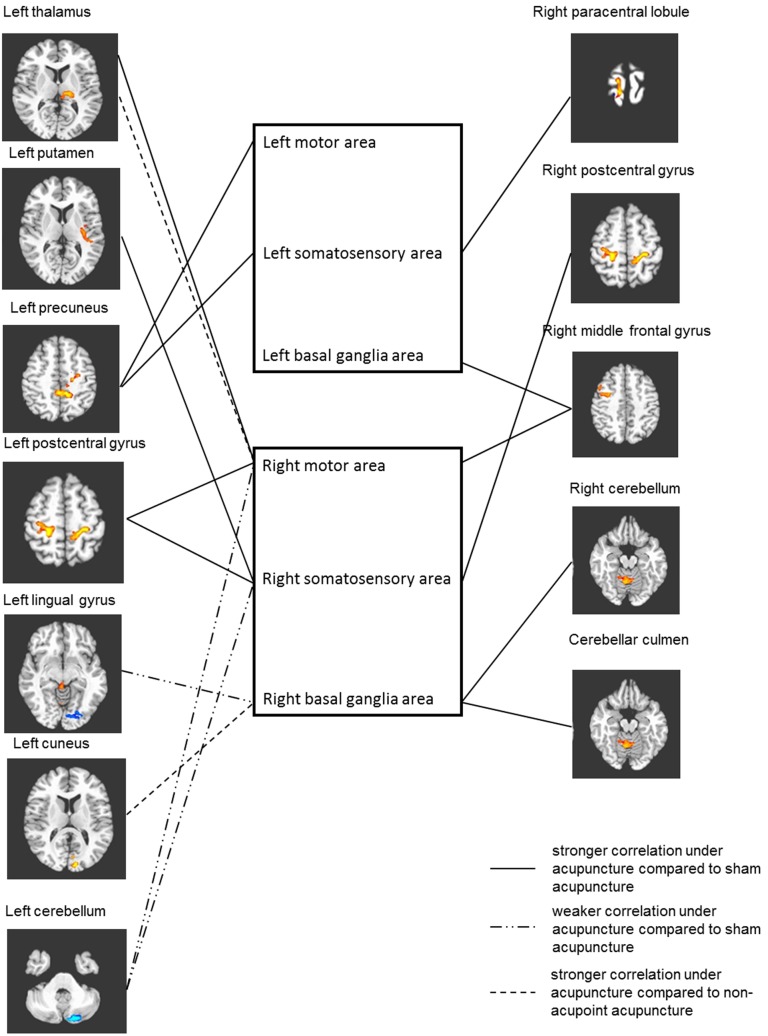
Figure 4. Differences of seed associated networks between ROIs from the left hemisphere and the right hemisphere.
Full line represents stronger correlation under acupuncture compared with sham acupuncture, whereas the “dash–dot–dot” line represents weaker correlation. Dash line stands for weaker correlation compared with nonacupoint acupuncture (P<0.05, multiple comparison error corrected using Monte Carlo simulation). Regions of the left hemisphere and right hemisphere that had significant differences in correlation with seeds are placed on left side and right side, respectively, and ROIs in the same box are from the same hemisphere.

