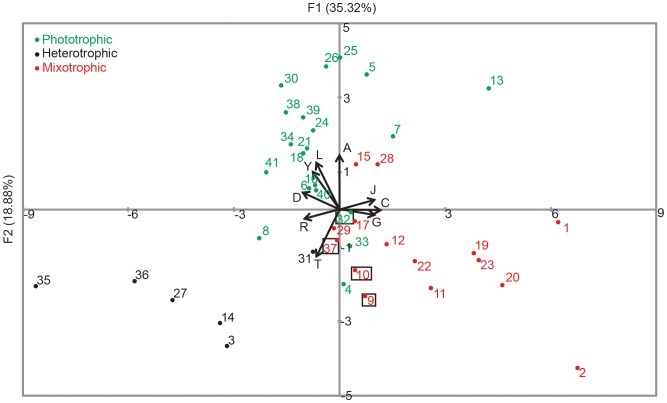
Figure 6. Principal component analysis (PCA) plot of the KOG distributions of the four prymnesiophytes in this study and of other protistan genomes and transcriptomes.
The same dataset from Fig. 5 was used to generate this figure. The color scheme and species identification by numbering also correspond to Fig. 5. Explained cumulative variability for this plot was 54.2%, with eigenvalues of 8.5 (F1) and 4.5 (F2). Only top variables for F1 and F2 are plotted in the graph.

