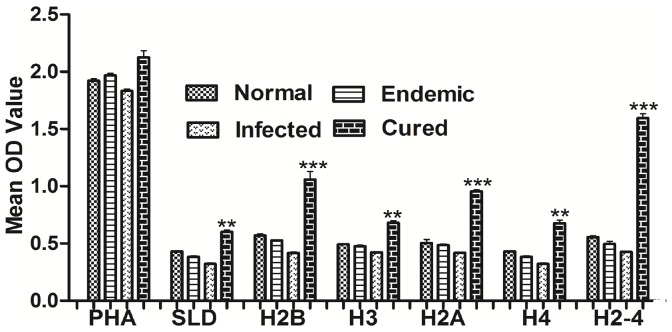
Figure 3. Cellular responses of rLdH2B, rLdH3, rLdH2A, rLdH4, and pooled (rLdH2-4) of L.donovani in patients sample.
: XTT response of PBMC from normal, L. donovani infected, Endemic and cured patients in response to PHA, SLD and rLdH2B, rLdH3, rLdH2A, rLdH4 and pooled (H2-4) at 10 µg/ml each. Proliferation was represented as mean OD of stimulated culture - mean OD of unstimulated control. Each bar represents the data (mean ± S.D. value) of triplicate wells ± the S.D. pooled (rLdH2-4) shown significantly higher cellular response. Significance values indicate the difference between the SLD and rLdH2B, rLdH3, rLdH2A, rLdH4, and pooled (rLdH2-4) stimulation (**, p<0.01; ***, p<0.001).

