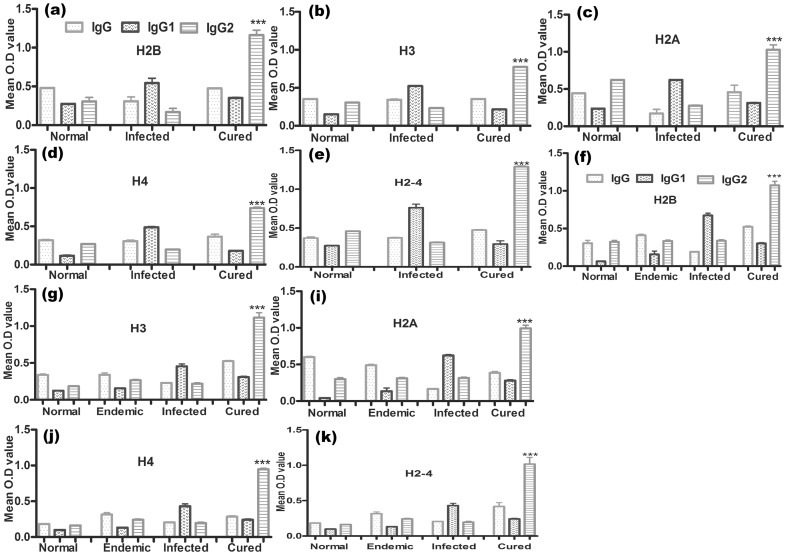
Figure 5. Antibody response shown (OD value) in hamster's serum with rLdH2B, rLdH3, rLdH2A, rLdH4 and pooled (H2-4).
(a, b, c, d, e) and in patient sample (f, g, h, i, j). Serum samples were collected from different groups of hamsters at designated time points and assayed for specific IgG, IgG1, and IgG2 levels by ELISA. Each bar represents the pooled data (mean±S.D. value) of three replicates. Significance values indicate the difference between the cured group and normal group (***, p<0.001).

