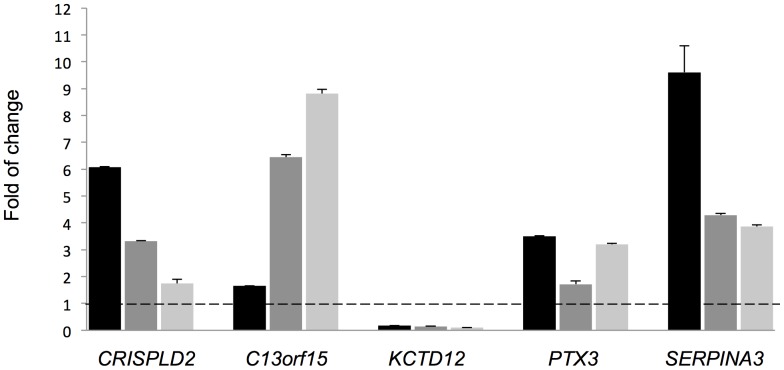
Figure 2. Validation of GC responsive genes.
After cells from three individual ASM lines were treated with 1 µM DEX for 18 h, the mRNA levels of indicated genes were measured by qRT-PCR and the folds of change induced by DEX were calculated. Each column bar represents an individual cell line; experiments for each cell line were performed in triplicate. Error bars are SE values corresponding to a cell line's replicates.

