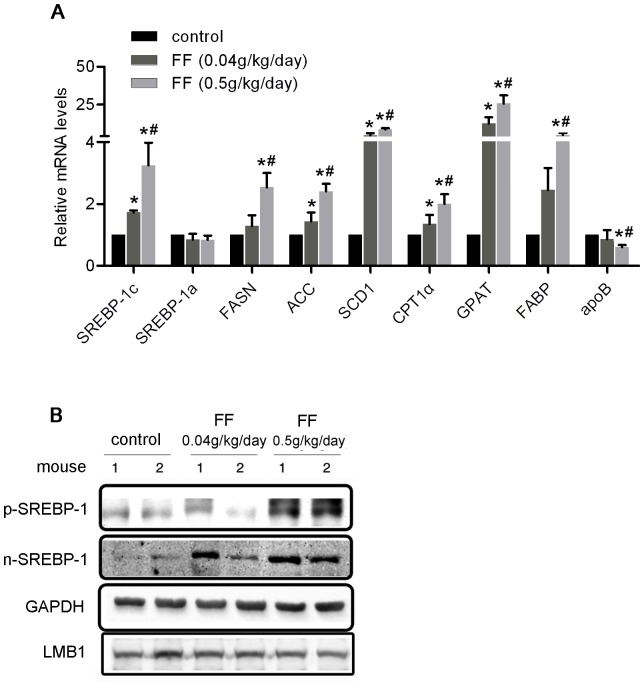
Figure 3. Pharmacological activation of PPARα by fenofibrate induced the expression of SREBP-1c.
(A-B) Eight-week-old male C57BL/6 mice were orally treated with or without fenofibrate at the indicated dosage (n = 6 per group) for 10 days: liver mRNA levels of SREBP-1c and related TG metabolism genes were determined using real-time PCR and normalized to β-actin. The values are reported as the fold-change relative to control mice, * P<0.05 versus the control group, # P<0.05 versus the fenofibrate 0.04 g/kg/day group and (B) the p-SREBP-1 and n-SREBP-1 proteins in the cytosolic and nuclear fractions, respectively, in the liver were detected through Western blotting. GAPDH and LMB1 were used as marker proteins for the cytosolic and nuclear fractions, respectively. The “1” and “2” represented different samples from different mouse in each group.

