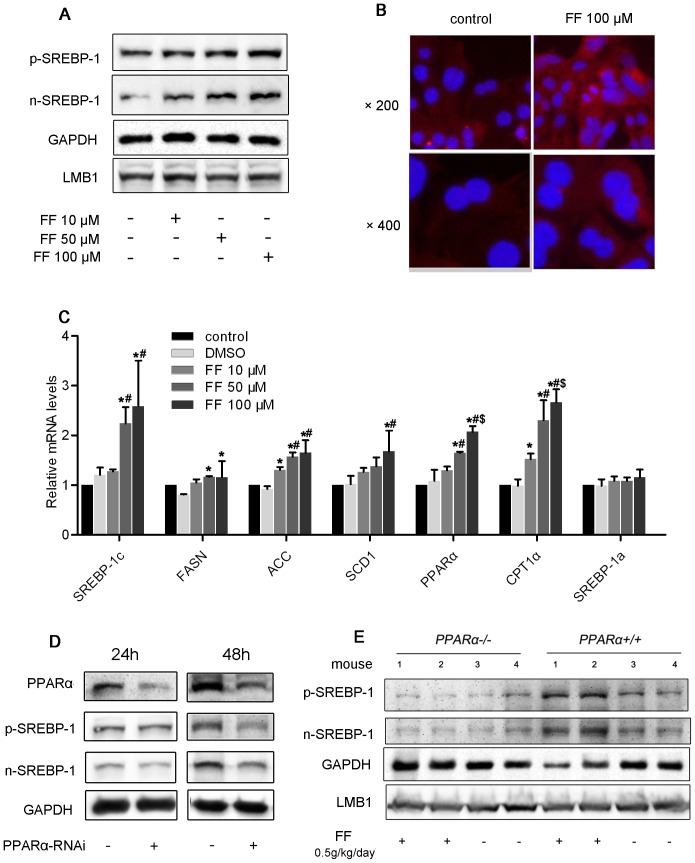
Figure 4. Fenofibrate induced the expression of SREBP-1c in HepG2 cells.
(A) HepG2 cells were cultured in serum-starved medium with or without fenofibrate for 48 h. Protein expression was analyzed using Western blotting of nuclear and cytosolic fractions. The results are representative of 3 independent experiments. (B) Visualization of SREBP-1 protein expression in cells through immunofluorescence staining. Primary hepatocytes were cultured in serum-free medium and stimulated with fenofibrate for 48 h. SREBP-1 protein was labeled with a fluorescent antibody (red), and nuclei were stained with DAPI (blue). Original magnification: 400×. (C) HepG2 cells were cultured in serum-free medium with or without fenofibrate for 24 h. The mRNA expression of SREBP-1c and related genes after 24 h was determined using real-time PCR and normalized to β-actin. The values are reported as the fold-change relative to the control group. The data are expressed as the mean ± SD. * P<0.05 versus the DMSO group. # P<0.05 versus the fenofibrate 10 µM group. $ P<0.05 versus the fenofibrate 50 µM group. (D) HepG2 cells were transfected with PPARα-RNAi or control-RNAi for 24 or 48 h, and SREBP-1 protein expression was analyzed by Western blotting. (E) Eight-week-old male Pparα−/− mice and Pparα+/+ mice were orally treated with or without fenofibrate at a dosage of 0.5 g/kg/day (n = 6 per group) for 10 days: p-SREBP-1 and n-SREBP-1 protein expression was detected by Western blotting. The “1”, “2”, “3” and “4” represented different samples from different mouse in each group.

