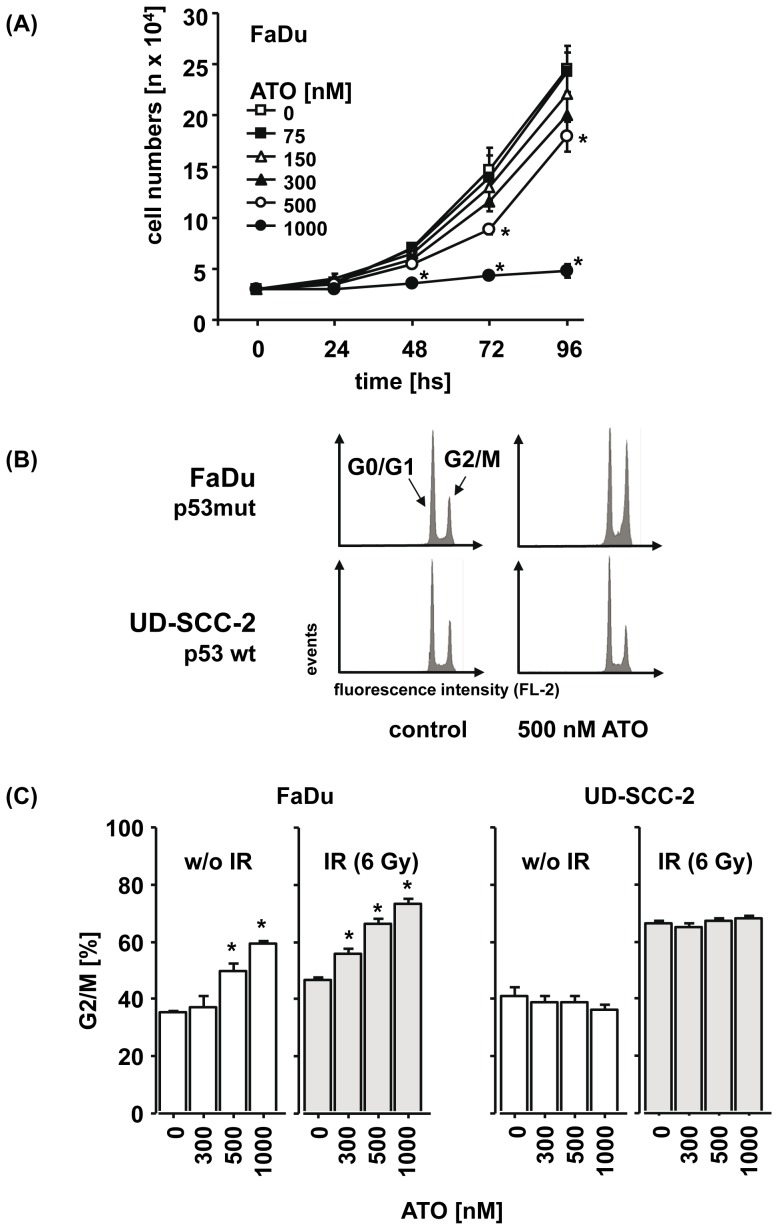
Figure 4. The growth-inhibitory effect of ATO in p53-deficient FaDu cells depends on dose and time and is associated with a cell cycle arrest in G2/M.
(A) FaDu cells were left untreated or were treated with increasing doses of ATO. After the indicated time, cells were harvested by trypsinization and cell numbers were counted. The mean cell numbers ± SEM of three independent experiments are presented. (B) Representative flow cytometry histograms of the cell cycle distribution are presented which were observed in p53-deficient FaDu (upper panel) and p53-proficient UD-SCC-2 cells (lower panel), either untreated (left) or after treatment with 500 nM ATO (right). (C) After treatment of FaDu cells and UD-SCC-2 cells with ATO, irradiation or the combination of both, cells were harvested and the relative numbers of cells in G2/M were determined by flow cytometry. The mean percentages ± SEM are presented. Asterisks mark samples for which significant differences compared to the untreated control (p<0.05) were observed.

