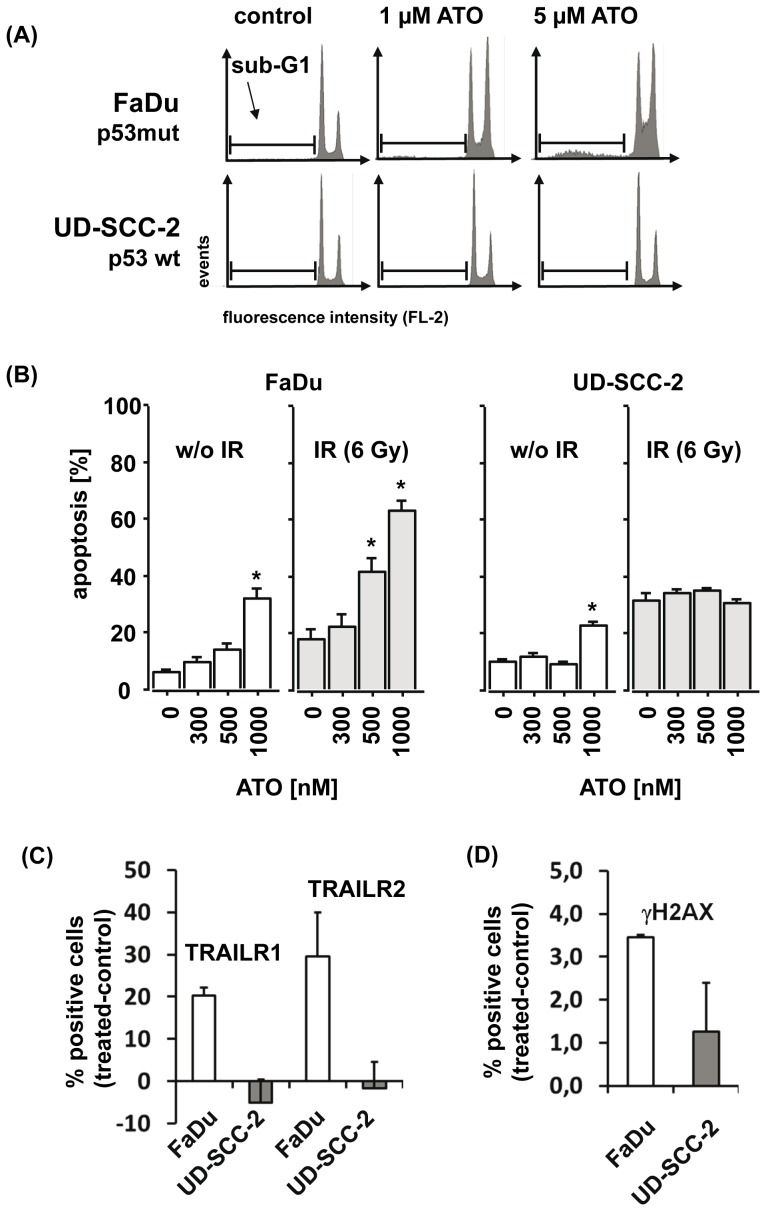
Figure 5. ATO induces apoptosis in p53-deficient FaDu but not p53-proficient UD-SCC-2 cells.
(A) Representative flow cytometry histograms of sub-G1 analysis after treatment of p53-deficient FaDu (upper panel) and p53-proficient UD-SCC-2 cells with the indicated doses of ATO are presented. (B) FaDu and UD-SCC-2 cells were left untreated or were treated with ATO for 96 hs at the indicated doses. The mean percentages of cells with features of apoptosis, detected by annexinV-FITC/PI staining and flow cytometry analysis are presented. *significant differences compared to untreated control (p<0.05). (C, D) FaDu and UD-SCC-2 cells were left untreated or were treated with 5 µM of ATO for 48 hs. The relative changes in the mean percentages of cells expressing TRAILR1 and TRAILR2 (C) or displaying residual DNA double strand breaks, as determined by gamma-H2AX staining (D) are presented.

