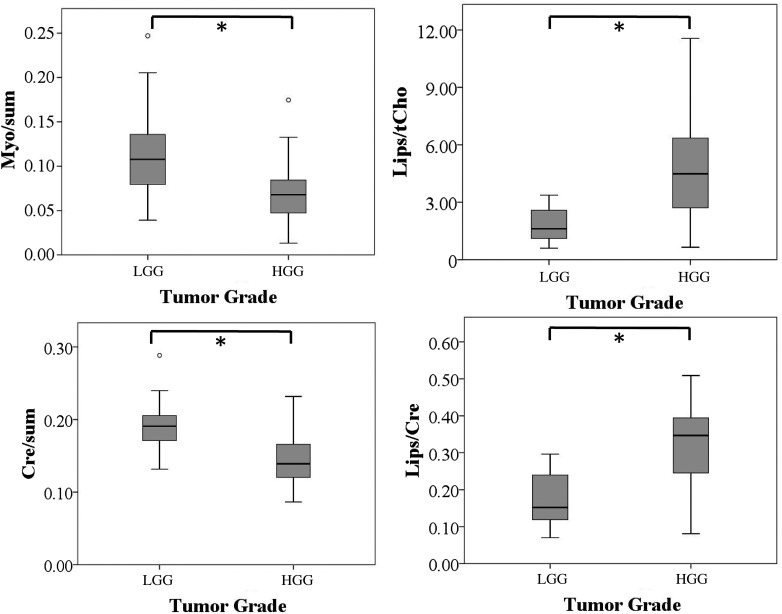
Fig. 3.
Box plots of the statistically significant CSI parameters against tumor grade. For the box plots of all considered CSI parameters, refer to Supplementary Fig. 1. Asterisk (*) indicates statistically significant differences (P < .05, Bonferroni corrected) of the respective CSI parameters with tumor grade. All metabolite ratios are dimensionless. Error bars indicate interquartile ranges.

