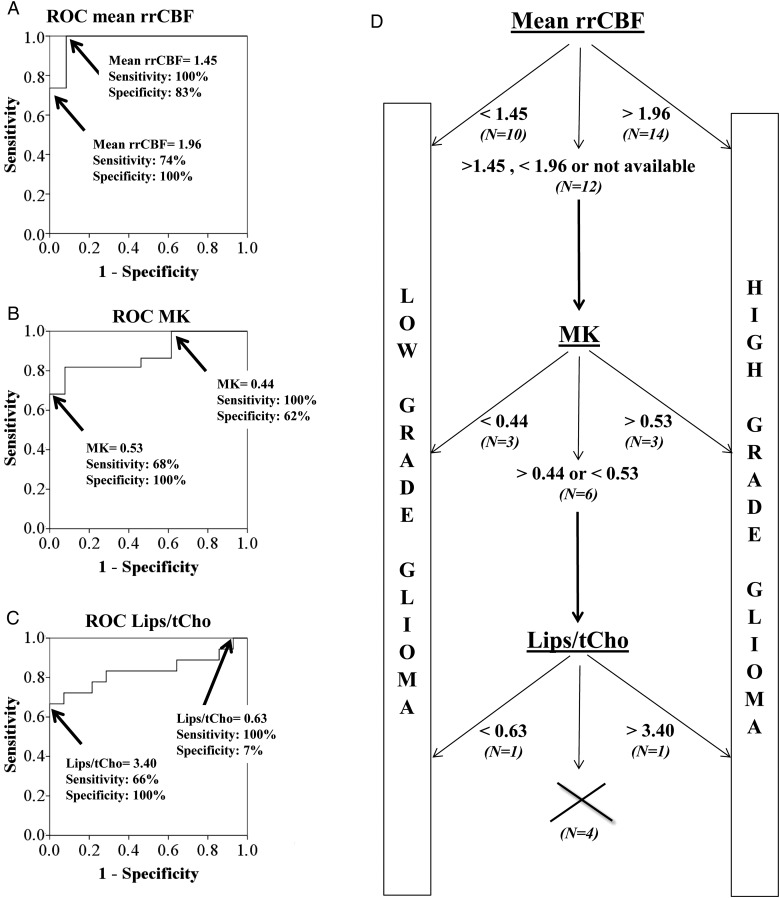
Fig. 5.
(A–C) ROC curves indicating the sensitivities and specificities of mean rrCBF-based, MK-based, and Lips/tCho-based differentiation between low- and high-grade gliomas, respectively. The 2 indicated points show the range where misclassifications can occur in this specific study population. The cutoff values indicated on the ROCs are an example obtained during a validation run randomly selected in the leave-one-out cross-validation. (D) Decision tree to distinguish low- from high-grade glioma in our study population based on the ranges of possible misclassification of mean rrCBF, MK, and Lips/tCho obtained for the leave-one-out cross-validation. The percentage of undecided cases after each decision step is indicated at each level. Nine percent of cases could not be classified using the proposed decision algorithm.

