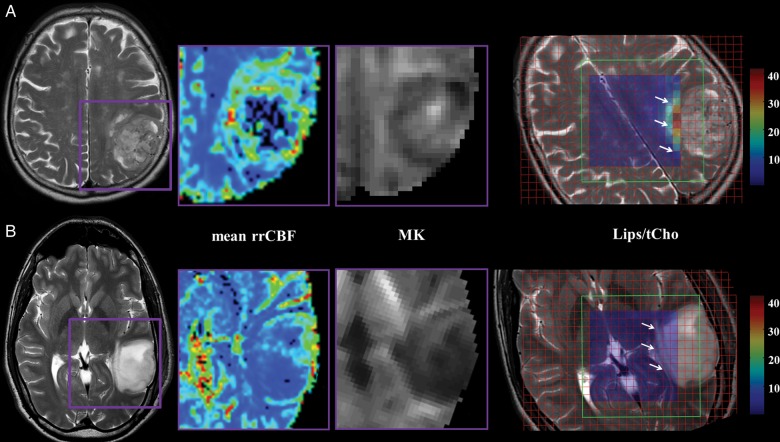
Fig. 6.
T2-weighted MRI, mean rrCBF, MK, and Lips/tCho maps of a 71-year-old female patient with GBM in the left parietal lobe (panel A) and a 35-year-old male patient with a grade II pilocytic astrocytoma in the left temporal lobe (panel B). The mean rrCBF and MK maps display the tumoral area in detail as indicated on the T2-weighted MRI with the purple box. Notice the high mean rrCBF and MK values in the high-grade glioma (top row) compared with the low-grade glioma (bottom row). The VOI of the CSI (green box) is superimposed on the T2-weighted images showing Lips/tCho ratios per voxel. The tumoral area is indicated with white arrows. Lips/tCho ratios are higher in high-grade glioma compared with low-grade glioma. Notice that only the center voxels are displayed in the color map for the sake of clarity, as the outer rows are affected by the chemical shift displacement error (CSDE). This CSDE can be defined as the difference in location of the center of the excitation or refocusing slices of 2 resonances with a different chemical shift, ie, Lips (0.9 and 1.3 ppm) and the carrier frequency of the water suppressed spectrum (2.2 ppm). Intensities of Lips/tCho are equally scaled in the parameter maps of the low- and high-grade glioma patient.

