Fig. 5.
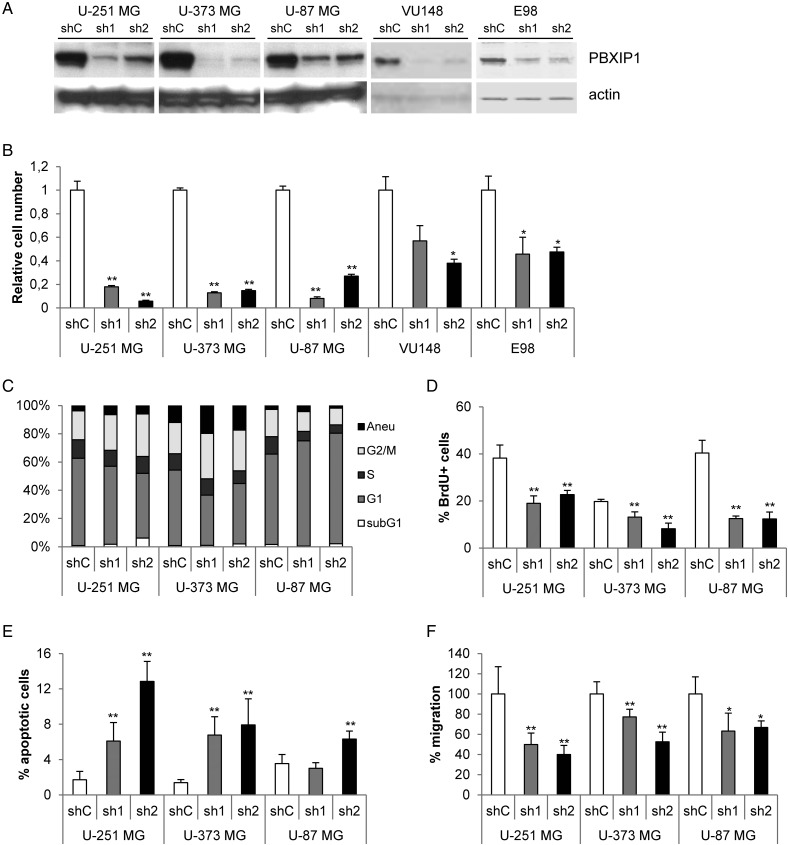
Loss of PBXIP1 expression affects glioma cell survival. Effective knockdown of PBXIP1 expression on protein (A) by 2 independent shRNA constructs (sh1 and sh2, respectively) compared with a nontargeting control shRNA (shC). (B) PBXIP1-knockdown resulted in reduced cell growth in U-251 MG, U-373 MG, and U-87 MG glioma cells as well as in the primary glioblastoma multiforme cell cultures VU148 and E98. The graph shows the cell number of the shRNA transduced glioma cells relative to nontargeting control shRNA after 4 days growth. (C) The graph shows the percentages of each cell cycle phase (subG1, G1, S, and G2/M. “aneu” is the fraction of aneuploidic cells with a DNA content larger than 4N) as determined by flow cytometry for the glioma cell lines that were transduced with the shRNAs indicated (D) The bar graph shows the percentage of BrdU-positive cells relative to the total number of (DAPI-positive) cells. (E) The bar graph shows the percentage of apoptotic cells that were visualized and counted after incubation with the CaspACE™ FITC-VAD-FMK In Situ Marker relative to the total number of (DAPI-stained) cells. (F) The bar graph shows the results of transwell migration assay. The number of migrated cells in the shPBXIP1-transduced glioma cells was quantified and depicted relative to the number of migrated cells of the nontargeting shRNA control-transduced glioma cells, which were set to 100%. (* indicates a statistical significance of P < .01 and ** a significance of P < .001 as determined by 2-tailed student t test analysis).

